The summer season is associated with plenty of things -- cookouts, vacations, higher gas prices -- but profitable stock trading typically isn't one of them. Chalk it up to the old-fashioned "Sell in May and go away" mentality, or to any number of other variables... but whatever the reason, many individual investors tend to adopt a "summer vacation" frame of mind toward their investments as the weather gets warmer.
But in 2019, there's simply no reason to pare down your trading approach along with your wardrobe when the temperatures change. The year-round 24/7 news cycle, coupled with the fact that options -- with all their endless flexibility in terms of time frame, directionality, and moneyness -- are more widely available and accessible than ever, means that it's possible to bag big profits on rapid stock moves just about every trading day of the year.
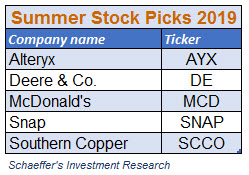
We've got 5 hot stock picks in particular that look set to heat up your portfolio this summer -- all hand-picked by our elite team of traders here at Schaeffer's, and all set to surprise the consensus on Wall Street by outperforming over the next several months. But before we highlight our top 5 names to trade through Labor Day, let's take a look at how the summer typically stacks up for stocks.
The Real Deal on Summer Seasonality
The table below, courtesy of Schaeffer's Senior Quantitative Analyst Rocky White, bottom-lines the average monthly returns over the past decade for each of three major equity-based exchange-traded funds (ETFs) -- the SPDR S&P 500 ETF Trust (SPY), Invesco QQQ Trust (QQQ), and iShares Russell 2000 ETF (IWM).
As you can see, July tends to be a standout for all three ETFs. SPY averages a 2.9% gain for the midsummer month, while QQQ's mean return is 4.44% -- making July the best month of the year for both benchmarks. The small-cap focused IWM, meanwhile, gains a very respectable 1.59% in a typical July.

Beyond that resoundingly bullish month, the May-September stretch offers plenty more opportunities for traders... particularly those who are using options to capture big price swings in both directions. Zeroing in on the month-by-month breakdown for SPY over the last decade, both May and September have a relatively elevated standard deviation of returns -- which means the trading activity tends to get a little more volatile than usual.
For example, take a look at September and its 60/40 split of positive and negative returns. During the month -- which tends to kick off with relatively sluggish trading action and lower volume surrounding the Labor Day holiday -- SPY averages a positive return of 2.96% and averages a negative return of 3.20%. With the broad-based equity benchmark likely to swing about 3% in either direction during the month, the overall average return of 0.49% for September over the last decade suggests the top-line seasonality data is deceptively flat.
In the same vein, May's average cumulative return in the last 10 years is a quiet 0.23% -- but that includes three negative returns that collectively average out to a SPY decline of 5.03%. So while the overall monthly number points to the kind of sleepy stock market seasonality where you can just leave your portfolio on auto-pilot, it turns out that when May gets bearish, it gets really bearish, really fast.

The Sectors Set to Get Hot (or Go Cold)
To complement the monthly SPY seasonality data above, White also rounded up the 10 best-performing and worst-performing sector ETFs of the past decade during the stretch of the calendar from Memorial Day to Labor Day. This offers a slightly different angle on which areas of the market could be poised to benefit from seasonal tailwinds -- or struggle against summer headwinds -- over the next several months.
Notably, the big bank-focused Financial Select Sector SPDR Fund (XLF) has been higher 100% of the time during this traditional summer period, with an average return of 3.29%. And interestingly enough, bonds are right behind; the iShares 20+ Year Treasury Bond ETF (TLT) rallies 90% of the time from Memorial Day to Labor Day, and boasts an average return of 3.81% for the period.
Only slightly less consistent is the SPDR S&P Biotech ETF (XBI), which sports 80% positive returns over this time frame. However, with an average return of 7.46%, XBI easily outperforms the typical summertime gains of both XLF and TLT... combined. Likewise, the FAANG-laden First Trust Dow Jones Internet Index Fund (FDN) adds 5.98% in an average summer, while the traditionally defensive SPDR S&P Pharmaceuticals ETF (XPH) advances a mean 5.09% for the period.

Blame it on supply and demand, perhaps -- at least in the Northern Hemisphere -- but solar stocks tend to underperform during the summer months. The Invesco Solar ETF (TAN) is positive only 40% of the time over the last decade, with the average summertime return amounting to a drop of 4.02%.
Other forms of energy also fare unimpressively from Memorial Day to Labor Day. The Invesco DB Oil Fund (DBO) shares TAN's 40% positive stat, and tends to decline 3.18% over the stretch. The VanEck Vectors Oil Services ETF (OIH) loses 4.06%, on average, with 42.9% positive returns. And while the VanEck Vectors Coal ETF (KOL) manages to gain an average of 1.24% by the time Labor Day rolls around, it's higher for the time frame only 50% of the time.
And then we have the Global X Social Media ETF (SOCL), which may just claim the prize for most unpredictable summer ETF action. While its relatively low percentage of positive returns since inception, at 57.1%, qualifies it for a spot on our list of the 10 worst sector funds, SOCL actually manages a very impressive 5.55% average return from late May through early September.

Now that we've got a firm handle on what to expect from stocks and sectors this summer, let's dive into those 5 hot summer stock picks -- all names with contrarian appeal that we predict will rally over the next several months, with upside targeted through early to mid-September.
VIEW AS ONE PAGE
Analytics Upstart Has Shorts Scrambling to Cover
California-based analytics platform provider Alteryx (AYX) has moved consistently higher since its March 2017 initial public offering (IPO) at $14 per share. The shares are up nearly 38% year-to-date as of this writing, and they've jumped 143% on a year-over-year basis.
AYX recently pulled back from new highs above the $84 level -- which marks six times its IPO price -- but the stock quickly found support at its rising 30-day moving average and the $75 level. Plus, the tech name recently crossed above the psychologically significant $5 billion market cap level.

Despite the strong price action, four analysts still rate AYX a tepid "hold," and its average 12-month price target of $86.60 implies expected upside of just 5.6% to the equity's current perch. This suggests that brokerage firms expect the stock's breakaway bullish momentum to essentially slow to a crawl going forward.
However, AYX is heavily shorted, as short interest has been rising right alongside the share price for much of the past year. No less than 16.8% of the stock's float is dedicated to short interest -- and with many of these bears likely to be in a losing position, short-covering activity could contribute to additional upside for the stock in the weeks and months ahead.
Finally, in its brief history as a publicly traded company, AYX has proven to be a real summertime standout. During the five-month stretch from April through August, the stock averages a return of 53.8%, according to Schaeffer's Quantitative Analyst Chris Prybal. Another bullish mid-year performance could easily help to shake loose some of the lingering Alteryx skeptics on Wall Street.
Skepticism Lingers on Bullish Oversold Construction Name
Shares of agricultural equipment giant Deere & Co. (DE) have formed a giant rounding-bottom pattern on the charts since early 2018. They've pushed their way to a gain of about 5% so far in 2019, and they're in the midst of a pullback to support at the $155 level, which has provided a firm floor since mid-January. This area is also home to a rising trendline connected DE's higher lows since October 2018.
Elsewhere on the technical front, DE's 14-day Relative Strength Index (RSI) has been finding support around the 40 level recently before pushing higher toward 50. This type of activity is reserved for bullish oversold stocks, and bodes well for a long play on DE at the moment.

There's plenty of pessimism priced into Deere shares, though. During the past 50 sessions, the stock has garnered a put/call volume ratio in the 86th percentile of its annual range, according to combined buy-to-open data from the International Securities Exchange (ISE), Chicago Board Options Exchange (CBOE), and NASDAQ OMX PHLX (PHLX). This elevated reading indicates a stronger-than-usual appetite for bearish bets over bullish among speculative DE players.
Likewise, the gamma-weighted Schaeffer's put/call open interest ratio (SOIR) of 1.13 reveals that puts outnumber calls among near-the-money DE option strikes set to expire within three months. In the months ahead, this skew toward at-the-money puts over calls could actually help the stock secure some structural, options-related support on the charts.
Don't Miss This Blue-Chip Buy Signal
Fast-food giant McDonald's (MCD) has freshly broken above its downtrend highs from November and January, and is trading right near its newly tagged all-time highs north of $191. The stock has capitalized on support at its 20-week moving average to gain 6.5% year-to-date, and just overhead is the $195 region -- which marks a 10% year-to-date return and a 20% year-over-year gain.
With MCD shares consolidating right below these round-number percentage returns, a breakout above here could be a catalyst to bring more buyers to the table. And April options expiration should help clear the stock's path higher, as the equity's top overall open interest position is the April 195 call, with roughly 8,600 contracts outstanding. The expiration of these overhead calls should eliminate an options-related hurdle for the shares in the immediate weeks ahead.

By and large, though, short-term traders continue to favor puts. MCD's SOIR of 1.15 indicates that puts comfortably outnumber calls among options set to expire within three months, even as the stock trades just a stone's throw from all-time highs. Whether these are speculative bearish plays or protective puts bought to insure paper profits, the predominance of put options over calls on this outperforming blue chip indicates that there's plenty of skepticism surrounding the bullish price action in MCD of late.
Also of note is the extremely low Schaeffer's Volatility Index (SVI) for MCD. This metric, which measures short-term, at-the-money implied volatilities for McDonald's options, currently stands at 13%, which ranks lower than 97% of other such readings over the past 52 weeks. This is encouraging for prospective MCD call buyers, as it indicates that the stock's front-month options have rarely priced in lower volatility expectations -- allowing option holders to reap the maximum benefits of limited risk and leveraged profits.
And in the case of MCD, this type of low SVI reading, when combined with the type of robust technical performance we're seeing now, has also been a bullish signal for the share price at least once before. According to White, there has been just one other time in the past 11 years where MCD stock was trading within 2% of annual highs while its SVI was in the 20th percentile or lower. One month following that signal, the stock was up 10.39%.
Analysts Are Over-the-Top on This Social Media Stock
Shares of Snapchat parent Snap (SNAP) have more than doubled already in 2019, but there's reason to believe the social media name is set to soar even higher as the summer heats up. The stock recently reclaimed the $10.50 area -- which previously served as major support in mid-2018, before switching roles to act as resistance in February and March. Now, this level appears to have resumed its prior role as a technical floor.
That technical victory followed a fundamental win for SNAP in early February, when the stock staged a massive bull gap following a blowout earnings report and well-received guidance. This marked only the second positive earnings reaction for the shares since SNAP's March 2017 IPO, and this particular post-earnings pop followed on the heels of a massive move lower in the stock during the second half of 2018. As such, there's the potential for a major shift in sentiment toward the stock over a longer time frame.

Notably, short interest on SNAP hit an all-time high as of the Feb. 1 reporting period -- just ahead of that big bull gap. Now, short interest is rolling over, and has declined by 28.7% off that peak. However, SNAP still sports a short-to-float ratio of 12.2%, which means there's plenty of sideline cash remaining to fuel additional upside as the weaker bearish hands hit the exits.
Analysts are also overwhelmingly gloomy. Among the 38 brokerage firms tracking SNAP, no fewer than 32 rate the stock a "hold" or "sell" -- and the average 12-month price target of $9.42 represents a discount to the current share price. But the social media stock has landed post-earnings upgrades from BTIG and RBC so far, and a continued migration to the bullish camp in the form of upgrades and/or price-target hikes could provide steady tailwinds over the coming months.
The Mining Name That's a Hot Commodity
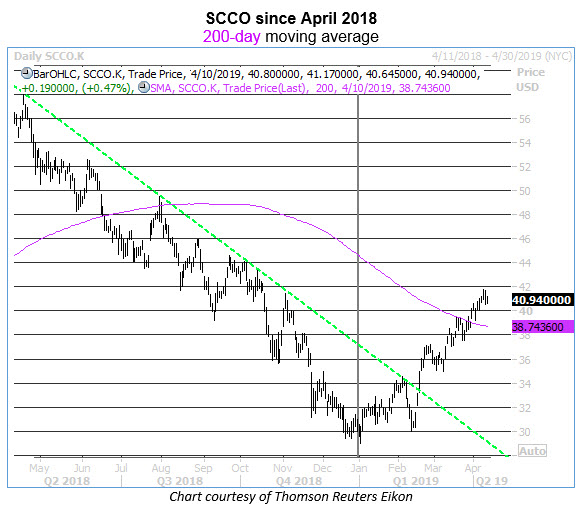
Since a mid-February earnings miss, shares of Arizona-based mining company Southern Copper (SCCO) have moved straight higher. Less than one week after that earnings report, in fact, SCCO broke out above a trendline connecting a series of lower highs in place since May 2018.
Since then, SCCO went on to cross above its 200-day moving average in late March. A move below this trendline in June 2018 preceded an additional 38% slide in the shares into the rest of 2018, so the stock's ability to reclaim -- and subsequently retest -- this benchmark moving average is significant.
From a broader perspective, the outperformance in this stock has been fairly massive; as of this writing, SCCO's 40-day relative-strength reading versus the S&P 500 Index (SPX) is 128.7%. Even more impressive is the fact that this outperformance for the industrial metals specialist comes amid consensus concerns about slowing world economic growth.
Shorts are in covering mode, given the stock's sudden breakout. With 8.3% of the security's float sold short, and a short-interest ratio of 6.4 days to cover, SCCO stands to benefit from an ongoing capitulation among this group in the weeks ahead.
A continued upgrade cycle could also be a boon. Currently, 60% of analysts call Southern Copper a "hold" or "sell," but there have been two upgrades since mid-February. Any additional bullish notes from this group in response to the positive price action could help to extend the stock's surge.